In this equation, µ is the specific growth rate. By using the above equation, the specific growth rate of the suspended cells of L. camara was found to be 0.1072/day as shown in Figure 35.2 .
4. Determination of the concentrations of nutrients or metabolites
Some nutrients in the cell suspension culture medium shows correlation with growth in a single culture flask. For example, total nitrate and phosphate levels in the medium can be used to understand the cell growth. Uptake of NH4+ ions may result in decrease in pH due to liberation of H+ ions. Its uptake may be at a slower or faster rate in comparison to phosphate. Complete utilization of phosphate from culture medium results in the onset of stationary phase sometimes for example, in L. camara, it was a major limiting nutrient for growth.
5. The conductivity method
The conductivity method of measuring growth kinetics of plant cell lines was used especially with the purpose of bioprocess engineering applications of plant cell cultures. The major advantages of using conductometry as the biosensing technique for measurement of plant cell growth kinetics are:
- The method is very economical and efficient.
- It gives accurate, reliable and reproducible measurements, while amenable to continuous on-line monitoring and process control.
- It is a noninvasive method which does not adversely affect the plant cells or the bioreactor operation.
- The kind of plant cell lines or their morphology does not affect the method itself.
6. Cell viability assay
At different parameters, cell viability in suspension cultures can be checked by using 1% fluorescein diacetate (FDA) solution. For an example, cell suspension of L. camara cultures were maintained at different agitation speed of 60-150 rpm, but 120 rpm only favored the fine suspension of live and healthy viable cells with small cell aggregates as is observed in fluorescein staining (Figure 35.3).
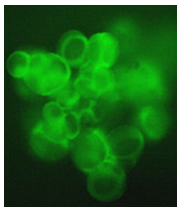
Figure 35.3: 3-week-old cells of L. camara stained with 1% fluorescein diacetate solution showing live dividing cells with intact cell wall.