Experiment-7 : Thermal conductivity of a Bad conductor using Lee's method                  Print this page
<< Previous |  First |  Last |  Next >>       

(10)  Plot a graph of temperature T of brass disc as a function of         time. A typical plot is shown in Fig. 2. Draw tangential line        to the curve, corresponding to the temperature, T2 and         determine its slope. The slope is equivalent to 
                        

   (11)  Calculate thermal conductivity, ‘K' using equn (3) and by multiplying a            correction factor
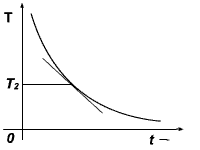
                          
          Here, h is the thickness of the brass disk. The correction
          factor is introduced because the cooling measurement was           not exactly the same environment of steady state           measurement.

    Figure 2
<< Previous |  First |  Last |  Next >>