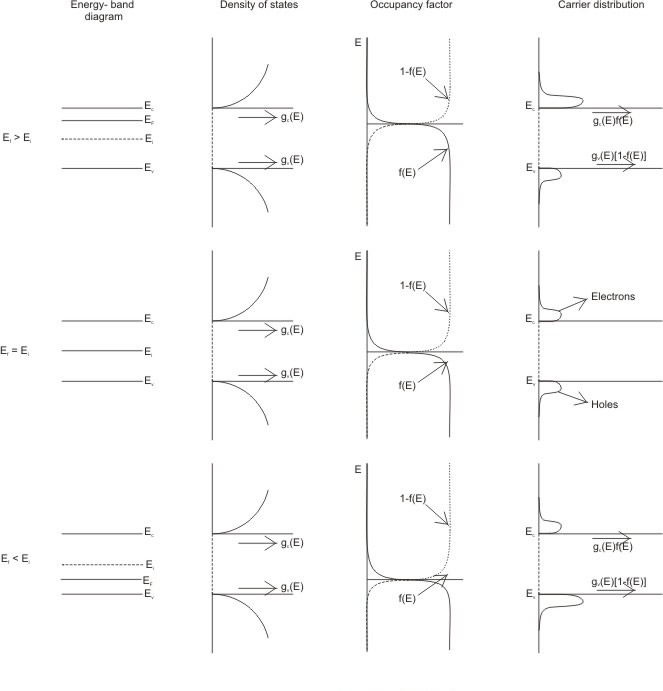
Carrier Concentration variation with Energy
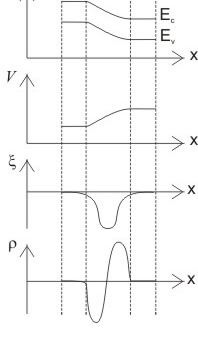
It is the plot of allowed electron energy states as a function of position along a direction
Carrier distribution vs. E for electrons can be graphed by multiplying g(E) and f(E). Carrier distribution vs holes can be graphed by multiplying  and (1-f(E)). and (1-f(E)).
This is shown in Fig. 7.2
When we have an electric field energy band diagram, bands bend with x.

potential energy 
Therefore, 

Kinetic energy is (E- Ec) in conduction band and  in valence band in valence band
Change Neutrality Equation
Maxwell's equation gives 
 semiconductor dielectric constant. semiconductor dielectric constant.
|