Coefficient-of-variation
The dimensionless coefficient-of-variation, CV, is defined as:
Percentiles
The percentile, p%, of an unquantized brightness distribution is defined as that value of the brightness such that:
or equivalently
Three special cases are frequently used in digital image processing.
* 0% the minimum value in the region
* 50% the median value in the region
* 100% the maximum value in the region.
All three of these values can be determined from Figure (1.6a).
Mode
The mode of the distribution is the most frequent brightness value. There is no guarantee that a mode exists or that it is unique.
SignaltoNoise ratio
The signal-to-noise ratio, SNR, can have several definitions. The noise is characterized by its standard deviation, .The characterization of the signal can differ. If the
signal is known to lie between two boundaries, .The characterization of the signal can differ. If the
signal is known to lie between two boundaries, then the SNR is defined as: then the SNR is defined as:
Bounded signal
 |
(1.B) |
If the signal is not bounded but has a statistical distribution then two other definitions are known:
Stochastic signal: S & N inter-dependent
 and S & N independent and S & N independent
where  and and  are defined above. are defined above.
The various statistics are given in Table 5 for the image and the region shown in Figure 7.
Statistics from Fig (1.7 )
|
Statistic |
Image |
ROI |
|
Average |
137.7 |
219.3 |
|
Standard Deviation |
49.5 |
4.0 |
|
Minimum |
56 |
202 |
|
Median |
141 |
220 |
|
Maximum |
241 |
226 |
|
Mode |
62 |
220 |
|
SNR (db) |
NA |
33.3 |
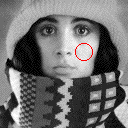
Fig (1.7 ). Region is the interior of the circle
A SNR calculation for the entire image based on equ (1.3) is not directly available. The variations in the image brightnesses that lead to the large value of s (=49.5) are not, in general, due to noise but to the variation in local information. With the help of the region there is a way to estimate the SNR. We can use the  (=4.0) and the dynamic
range, (=4.0) and the dynamic
range,  , for the image (=241-56) to calculate a global SNR (=33.3 dB). The underlying assumptions are that (1) the signal is approximately constant in that region and the variation in the region is therefore due to noise, and, (2 ) that the noise is the same over the entire image with a standard deviation given by , for the image (=241-56) to calculate a global SNR (=33.3 dB). The underlying assumptions are that (1) the signal is approximately constant in that region and the variation in the region is therefore due to noise, and, (2 ) that the noise is the same over the entire image with a standard deviation given by  . .
|