

Contents
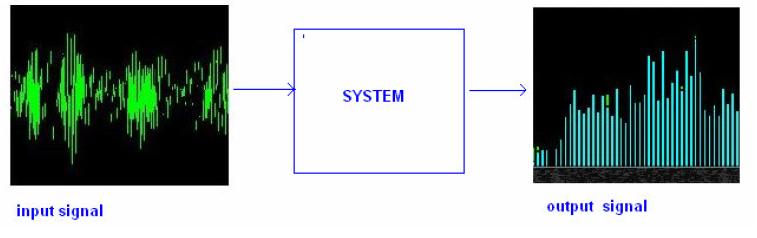
Use of FFT in Windows Media Player(contd)
FREQUENCY RESOLUTION:
DEFINITION:
Minimum Frequency interval discernable.
i.e. Lesser the value of resolution , better it is.
Frequency Resolution (F. R.) = 1/T
Reciprocating Bandwidth =1/ (time constant)
PHYSICAL SIGNIFICANCE OF F.R. & T :
Larger time window:
1.Better Resolution
2.Slower processing( Longer Time Window & more data to crunch)
FR=WWWW1/TC
Smaller Time Window:
1.Lower Resolution
2.Faster processing
Frequency resolution is directly dependent on reciprocal bandwidth...Lesser the bandwidth
Better is the resolution of the spectrum.
WINDOWS MEDIA PLAYER:
Say, if you want to have 50 dancing bars; then to get 50 bars (reciprocal Bandwidths) in the range 0-20 KHz.,
we should get reciprocal bandwidth of 400 Hz.
Time constant = sampling time period
= (1/reciprocal bandwidth)
For 50 bars, we need 2.5 ms sampling time period.
It is not that we are not able to sample finer; but the finer sampling (i.e. lesser T
Would lead to lesser resolution.)
If we take T large, bandwidth will be smaller .It will lead to more number of
Bars; but this might be undesirable as large number of bars might look unpleasant.
It is our choice what time period to choose. According to our convenience , we should
choose the sampling time .
In above case, as the bandwidth is 400 Hz.,the frequencies corresponding to multiples of 400 Hz would get the
place in frequency spectrum ; but what about the frequencies which lie in between multiples of 400Hz?
DISTRIBUTION OF FREQUENCIES BETWEEN MULTIPLES OF 400 Hz:
1) If signal has frequency between say,400 Hz & 800 Hz, then that signal will be detected but
Its part would be put in .400 Hz & part in 800 Hz.
2.)One way to measure this signal accurately (say 500 Hz) is to take a time record that is
(1/ 500) or 2 ms long.Then the signal will lie all in one frequency bin.
3.)But this would require changing the sample rate based upon the signal (which you have not measured yet).
4.)This not being the good solution, the way to measure the signal accurately is to lengthen the time record &
change the span of the spectrum.
Thus, audible frequency range gets divided into bands of frequencies whose magnitude (height of
column) depends upon the distribution of frequencies in audio signal & when at particular signal
sample, frequencies corresponding to particular band appear, the height of column corresponding
to that band varies with amplitude of the signal.
Properties:
1) Linearity:Log Scale: The dancing bars are nothing but the plot of intensity versus that particular frequency band. Here, intensity is plotted in decibel i.e. log scale. Hence, if u add 2 signals with same frequency & intensity , it does not give you the length of the column doubled. But the length increases lesser than that due to log nature of the intensity column.. Hence, it is not linear in nature.
2) Causality & memory:
The frequency spectrum depends upon the instantaneous value of the input signal. Hence, it is causal & memoryless system.
3.)Stability:
If maximum amplitude of the applied sampled signal is A, then the length of the column of bandwidth corresponding to that particular frequency is proportional to (kLog A). where k is finite constant.
If |amplitude | < A
| length of column of band | < kLog A.
Therefore, it is a stable system.
4. ) Shift Invariant System:
It is shift invariant system, as for input at time t1 , frequency spectrum is not going to change , as it depends upon the instantaneous value.
5.) Non-Invertible system:
For system to be invertible, it should be uniquely determined .It happens only when sampling rate is higher than twice the highest frequency component. i.e. If sampling rate is minimum 40 KHz, then it is invertible but for our frequency spectrum where only 50 reciprocal bands are there this frequency is too large. Hence intermediate frequencies get distributed in adjacent bands. Therefore, it is not possible to have original acoustic signal from the dancing bars.

