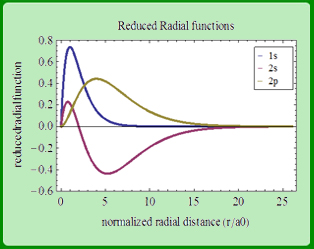
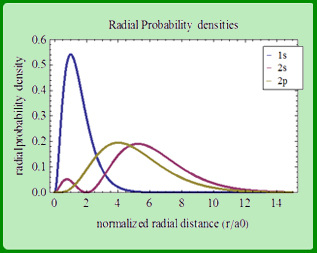
To compare the differences between the functions 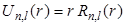 and and 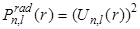 for the n = 1 and n = 2 states of hydrogen, they are plotted on the same graph as shown in the following Figure - 9.9 and Figure - 9.10: for the n = 1 and n = 2 states of hydrogen, they are plotted on the same graph as shown in the following Figure - 9.9 and Figure - 9.10:
- The increase in l by 1 from 2s to 2p states means that neither
 nor nor  have nodes. Asymptotically, both functions decay at the same rate as their 2s counterparts, because the decay constant for a pure- Coulomb potential energy doesn't depend on l. have nodes. Asymptotically, both functions decay at the same rate as their 2s counterparts, because the decay constant for a pure- Coulomb potential energy doesn't depend on l.
- The sole peak in occurs at r = 4
 , where its value is 0.19. Interestingly, the mean radius of 2p state = 5 is 1smaller than that of the 2s state. , where its value is 0.19. Interestingly, the mean radius of 2p state = 5 is 1smaller than that of the 2s state.
- In the plots of reduced radial functions
 , ,  and and  , note the differences in these functions rise from 0. The functions and rise like r, in which is faster than while rises like , note the differences in these functions rise from 0. The functions and rise like r, in which is faster than while rises like  . .
|