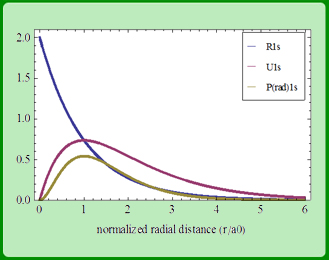
In the following Figure - 9.4, we plot the radial functions  , the reduced radial functions , the reduced radial functions 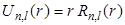 , and the radial probability densities , and the radial probability densities 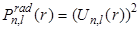 for different states of hydrogen atom. We will also see the plot for different orbitals of hydrogen atom. for different states of hydrogen atom. We will also see the plot for different orbitals of hydrogen atom.
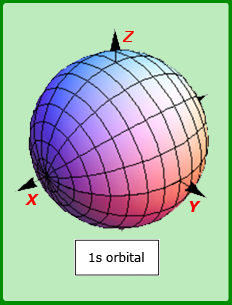
The first orbit n = 1, l = 0 and  = 0, the K shell = 0, the K shell
- In this plot we can see the effect of the factor r in
 . Here, . Here,  goes to 2 goes to 2 (Bohr radius) at r = 0, while (Bohr radius) at r = 0, while  goes to zero. The factor of r in goes to zero. The factor of r in also introduces a peak at 1. also introduces a peak at 1.
- There is no node for 1s state.
- The probability density
 goes to zero at r = 0, it means that the probability of finding the electron at the nucleus is zero. goes to zero at r = 0, it means that the probability of finding the electron at the nucleus is zero.  shows also a peak at 1 which is the same as Bohr radius and the peak value is 0.54. shows also a peak at 1 which is the same as Bohr radius and the peak value is 0.54.
- Conceptually, peaks in
 are radii near which an electron in a state are radii near which an electron in a state  is most likely to be found. is most likely to be found.
- Because of the gradual decay of on the large-r side of this peak, the calculated mean radial position turns out to be larger than the location of the peak.
|