Even though TTT diagrams are very useful for studying microstructures, in most of the cases of practical interest, the transformations take place not isothermally but during continuous cooling. Hence, the so-called Continuous Cooling Transformation diagrams (CCT diagrams are very important).
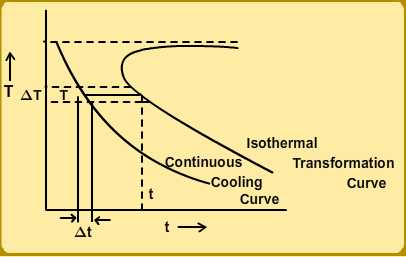
It is possible to go from TTT diagrams to CCT diagrams under certain circumstances, namely, if we assume that the kinetics of the transformation depends only one the fraction of the phases transformed and the temperature. In Figure 7 we show how to calculate the CCT diagram from the isothermal transformation curve, schematically; the steps involved are as follows: |