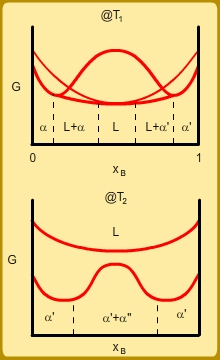
- Shown in Fig. 18 is a simple phase diagram which has a miscibility gap at low temperatures. Show the
 versus
  diagram at the tempratures
  and
and  marked on the phase diagrm.
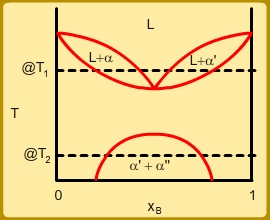
Figure 18: Phase diagram with a miscibility gap at low temperatures.
|
|
||||
| Part I : Preliminaries (Thermodynamics and Kinetics) | ||||||
| Module 3: G versus xB curves and phase diagrams | ||||||
|
||||||