Lecture 2
BATH TUB CURVE
Most products go through three distinct phases from product inception to wear out. Figure below shows a typical life cycle curve for which the faiure rate is plotted as function of time.
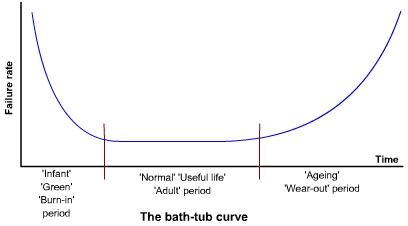
Infancy / Green / Debugging / Burn-in-period: Many components fail very soon after they are put into service. Failures within this period are caused by defects and poor design that cause an item to be legitimately bad. These are called infant mortality failures and the failure rate in this period is relatively high. Good system vendors will perform an operation called "burn in" where they put together and test a system for several days to try to weed out these types of problems so the customer doesn't see them.
Chance failure / Normal Operating Life: If a component does not fail within its infancy, it will generally tend to remain trouble-free over its operating lifetime. The failure rate during this period is typically quite low. This phase, in which the failure rate is constant, typically represents the useful life of the product.
Wear out / Ageing: After a component reaches a certain age, it enters the period where it begins to wear out, and failures start to increase. The period where failures start to increase is called the wear out phase of component life.
Reliability Determination
In the adult or mature phase the failure rate of a component or system is constant. Under such conditions the time to failure follows an exponential law, and the probability density function of exponential distribution is as given below:
Where ? denotes the failure rate. The Mean time to failure MTTF for the exponential distribution is
MTTF = 1 / ?
If the failure rate is constant, the MTTF is the reciprocal of the failure rate. For repairable system it is also equal to MTBF.
The reliability at time t, R(t), is the probability of the product lasting up to at least time t. It is given by
EXAMPLE:
Assume we have an automobile that is operating in its mature phase and has the following failure history:
Time to failure (hours): 100 800 1280 2600
The MTBF is given by: [100+800+1280+2600] / 4 = 1195 hours/failure
This gives a constant failure rate of: 1 / 1195 = 0.000836 failures/hour.
What reliability can be expected from the automobile after 40, 200, 1000, and 5000 hours?
| t-hours | 40 | 200 | 1000 | 5000 |
| Reliability | 97% | 84.6% | 43.4% | 1.5% |
Being able to predict reliabilities is particularly useful in terms of maintenance scheduling of machinery.
Assume a minimum reliability of 0.9 can be accepted from the automobile, at what point would a service be required?
Thus, the automobile needs servicing every 126 hours to keep a minimum reliability of 0.9