Lecture 6
Control Charts (Figure)
Control charts are statistical tool, showing whether a process is in control or not. It is a graphical tool for monitoring the activities of an ongoing process also referred as Shewhart control charts. Control charts are used for process monitoring and variability reduction.
Before discussing and calculating the limits etc. of control charts, it is necessary to understand causes of variations present in the system. Variability is an inherent feature of every process. Production data always have some variability.
Causes of Variations
Two types of causes are present in the production system
-
Special causes: Variation due to identifiable factors in the production process. Examples of special causes include: wrong tool, wrong production method, improper raw material, operator's skill, wrong die etc. Control of process is achieved through the elimination of special causes. According to Deming, only 15% of the problems are due to the special causes. Special causes or also sometimes referred as Assignable causes
-
Common causes: Variation inherent in the process. Improvement of process is accomplished through the reduction of common causes and improving the system. According to Deming, 85% of the problems are due to the common causes.
Assignable causes are controlled by the use of statistical process charts.
Steps in constructing a control chart
-
Decide what to measure or count
-
Collect the sample data
-
Plot the samples on a control chart
-
Calculate and plot the control limits on the control chart
-
Determine if the data is in control
-
If non-random variation is present, discard the data (fix the problem) and recalculate the control limits
-
When data are with in the control limits we leave the process assuming there are only chance causes present
A process is in control IF
- No sample points outside control limits
- Most points near process average or center line
- About equal number of points above and below the center line
- Sample point are distributed randomly
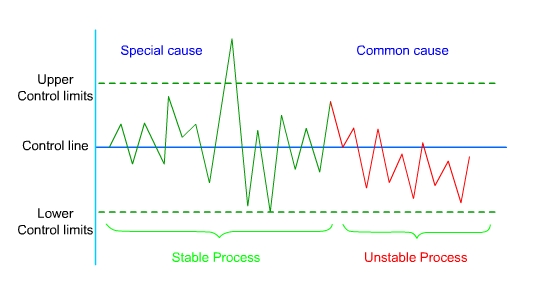
Figure: Control Chart Representing Limits, Special Causes, Common Causes