Different Phases in Polymeric Materials:
Unlike metals and ceramics, the solid phase of polymers are
characterized by four major phases: Glassy Phase, Transition Phase,
Elastomeric Phase and Rubbery Flow region. Each phase has distinct
mechanical properties related to the microstructure of the Polymer.
However, the extent up to which these phases are expressed varies
from polymer to polymer. The figure below shows various phases:
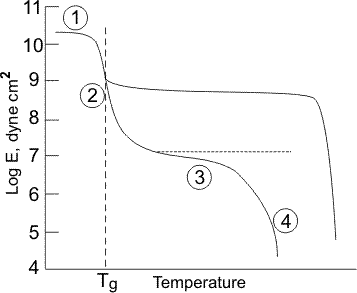
When the temperature is well below the glass transition temperature,
you will obtain the glassy-phase of the polymer. Depending on the
cooling rate, for some polymers you may also find a semi-crystalline and
semi-amorphous phase. Often, the polymers in the glassy state, show
good mechanical properties like higher modulus, strength and hardness.
The polymer in this stage shows a high resistance to flow. The modulus
of elasticity at this stage may be defined by the following relationship.
εp = f(σ/E1)+(1-f)((σ/E2)
E= σ/ε = {f/E1 + (1-f)/E2)-1
where f is the fraction of stiff covalent bond
f=1 : E= E1 = 1000 GPa (Diamond)
f=0: E=E2 = 1 GPa (Paraffin wax)
f=0.5 to 0.75 E-3-8 GPa
As the polymer is heated from the glassy phase, the polymeric
chains start to slide against each other gaining their mobility. This
continues over a range of temperature until it reaches a plateau
again known as the elastomeric phase.
The transition stage from amorphous to elastomeric phase is
defined as the glass transition phase. The temperature
corresponding to the centre of the transition region is defined as
the glass-transition temperature or Tg.
For the polymeric materials, especially for the thermo-plastic
polymers, Tg plays a crucial role as the mechanical properties like
elastic modulus and strength sharply fall below this temperature.
Also, the material shows a highly lossy behaviour which is
exploited in designing damping materials.
In this region E at different Temperature could be superimposed
by shifting data from a log – log plot of E vs time from any
temperature
WLF Equation: Log aT = C1(T-Tr)/(C2 + T – Tr)
One of the first pieces of data anyone looks at while evaluating a
potential new material for Printed Wiring Board (PWB)
applications is its Glass Transition Temperature (Tg)
Tg's of materials used run from 1150 C (FR-4) to about 2500 C (for
high-end polyimide materials) with an almost unbroken continuum
in between based on various classes of resins, cross-linking
agents and blending ratios.
At this stage let us briefly discuss about different procedures to
measure the Tg of a polymer. |