Temperature Entropy Diagram
Entropy change of a system is given by  . During the reversible process, the energy transfer as heat to the system from the surroundings is given by . During the reversible process, the energy transfer as heat to the system from the surroundings is given by
 |
(24.1) |
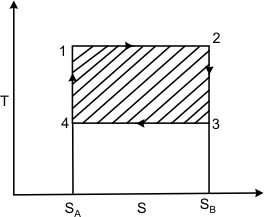
Figure 24.1
Refer to figure 24.1. Here T and S are chosen as independent variables. The  is the area under the curve. The first law of thermodynamics gives is the area under the curve. The first law of thermodynamics gives  . Also for a reversible process, we can write, . Also for a reversible process, we can write,
and  |
(24.2) |
Therefore,
 |
(24.3) |
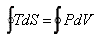
For a cyclic process, the above equation reduces to
 |
(24.4) |
For a cyclic process, the above equation reduces to
For a cyclic process represents the net heat interaction which is equal to the net work done by the system. Hence the area enclosed by a cycle on a T − S diagram represents the net work done by a system. For a reversible adiabatic process, we know that
 |
(24.5) |
or,
 |
(24.6) |
or,
 |
(24.7) |
Hence a reversible adiabatic process is also called an isentropic process. On a T − S diagram, the Carnot cycle can be represented as shown in Fig 24.1. The area under the curve 1-2 represents the energy absorbed as heat  by the system during the isothermal process. The area under the curve 3-4 is the energy rejected as heat by the system during the isothermal process. The area under the curve 3-4 is the energy rejected as heat  by the system. The shaded area represents the net work done by the system. by the system. The shaded area represents the net work done by the system.
We have already seen that the efficiency of a Carnot cycle operating between two thermal reservoirs at temperatures T1and T2  is given by is given by
 |
(24.8) |
This was derived assuming the working fluid to be an ideal gas. The advantage of T − S diagram can be realized by a presentation of the Carnot cycle on the T − S diagram. Let the system change its entropy from  to to  during the isothermal expansion process 1-2. Then, during the isothermal expansion process 1-2. Then,
 |
(24.9) |
and,
 |
(24.10) |
and,
or,
 |
(24.11) |
This demonstrates the utility of T − S diagram.
|