Raman Scattering (contd...)
Figure 7.14 is an example where large changes in concentration are accompanied by significant changes in temperature as well. Here, hydrogen burns in air while the products of combustion include water, residual oxygen, nitrogen (that remains passive during the combustion process), and residual oxygen and hydrogen that remains unburnt through the flame. One can think of pressure as remaining practically constant (and equal to the atmospheric value) in the zone of investigation. Nitrogen peaks in the spectra can once again be used as signature of temperature. Note that the intensity diminishes with increasing temperature (for a given nitrogen concentration). This is understandable because the intensity values scale with the number density which, in turn, is inversely proportional to absolute temperature.
With reference to Figure 7.14, the hydrogen and oxygen concentrations are high, ahead of the flame. They progressively get consumed in the flame and reactions are complete behind the flame. Species concentration change in the zone of reaction. Beyond the flame, spectral changes will occur due to that in temperature. As expected, the concentration of H2O after combustion is seen to be quite high.
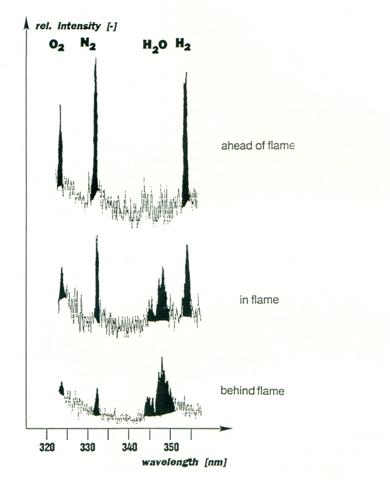
Figure 7.14: Raman spectra recorded in a hydrogen gas flame, hydrogen burning in air. Figure adapted from Mayinger (1994). |