Raman Scattering
Raman scattering is seen in materials composed of molecules (as opposed to single atoms as in monatomic gases). Here, the molecules may have rotational and vibrational modes of motion, apart from the translational. These modes are quantized and, as a result, all energy levels are split further into rotational and vibrational states. Specifically, the ground state is split as well, shown schematically in Figure 7.10. Thus, electrons may undergo transition from one of the higher ground states to the first energy level. After a certain residence time, these may return back to the true ground state. The difference between the two frequencies is proof of the Raman effect . In experiments, the frequency shift is the signal of interest and is material specific. Thus, Raman scattering is most commonly used for identifying species in a certain medium solid, liquid, or gas. The intensity of the scattered signal is a measure of the number density of the species, and hence its concentration. If concentration is known, the signal can be used to determine pressure and temperature.
Raman signals can be expected from spontaneous emissions within the medium. Such signals tend to be very weak and stimulated emission is more often used in engineering measurements. The stimulant is the laser and one can detect Raman shifts in frequency with reference to that in the incident laser beam. Since Raman signals generally weak, a high power laser is necessarily required, adding to the cost of the experimental apparatus.
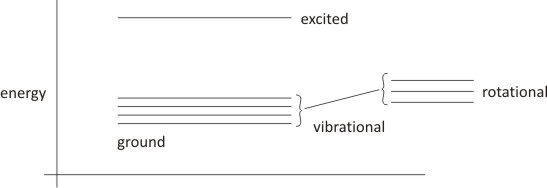
Figure 7.10: Energy states in molecules showing quantization of the ground state into vibrational and rotational levels.
When the emitted photon has a frequency less than the one absorbed, the frequency shift is called a red shift and is shown schematically in Figure 7.11 (left). When the frequency of the emitted radiation is greater than the one absorbed, one obtains the blue shift (Figure 7.11, right).
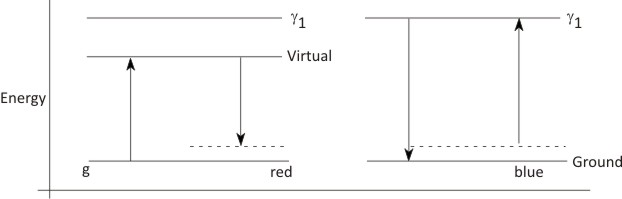
Figure 7.11: Schematic drawing of transitions in Raman spectroscopy. Left: red shift, also called Stokes red shift; Right: blue shift, also called the anti-Stokes blue shift. |