Figure 5.32 shows concentration contours around the growing crystal derived from the schlieren images of Figure 5.31. The physical extent of the convective plume in the vertical direction can be estimated by the deformation of the concentration contours. Densely placed contours in the crystal vicinity are due to high concentration gradients. The contours at t=30 hours are seen to spread into the growth chamber, indicating that solute from the bulk of the solution itself is deposited over the crystal. The appearance of double peaks in the contour shape at the end of 30 hours confirms that the highest gradients and hence the deposition rates occur towards the edges of the crystal.
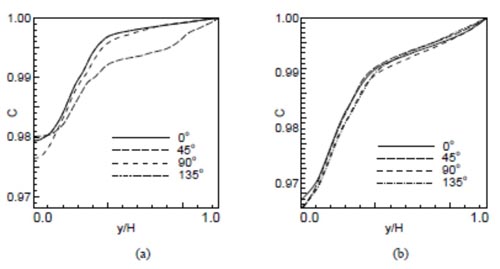
Figure 5.33: Width-averaged concentration profile as a functionn of the vertical coodinate around a growing crystal in the stable convection regime after a period of (a) 2 hours, and (b) 30 hours.
Figure 5.33 shows the distribution of width-averaged concentration with respect to the vertical coordinate at two time instants, namely 2 and 30 hours. The concentration data presented in the figure is integrated along the viewing direction by the light beam, and once again across the width of the image. The differences among the individual profiles for each of the view angles are a measure of loss of symmetry in the concentration distribution above the crystal. At t=2 hours, the differences are large in the bulk of the solution  . The difference diminishes at locations closer to the crystal . The difference diminishes at locations closer to the crystal  , Figure 5.33(a). With the passage of time, the convective plume stabilizes in terms of symmetry. The average concentration data corresponding to t=30 hours for the four view angles reveals a good degree of symmetry in the entire field of view above the crystal (Figure 5.33(b)). , Figure 5.33(a). With the passage of time, the convective plume stabilizes in terms of symmetry. The average concentration data corresponding to t=30 hours for the four view angles reveals a good degree of symmetry in the entire field of view above the crystal (Figure 5.33(b)).
|