| |
The initial size of the crystal used in the infinite fringe setting had to be larger than that of wedge fringes. This is because the convection patterns with a small crystal did not produce sufficient contrast in the interferograms, and could be recorded by the camera.
The growth sequence using schlieren and shadowgraph techniques is shown in detail in Figures 5.17 and 5.18. They confirm the evolution pattern of the convection field recorded by the interferometer. The first image in the schlieren and shadowgraph sequences shows initial dissolution of the seed just after its insertion into the solution. A sharp descending plume originating from the seed can be seen. The intensity contrast is related to an abrupt change in the solute concentration around the seed crystal, which creates a jump in the refractive index, and deflects the light beam into the region of relatively large concentration gradients. The schlieren arrangement is more sensitive to the change in concentration, producing a greater intensity contrast, when compared to the shadowgraph. After the initial dissolution, the growth process of the crystal is initiated. The associated convection currents are larger, and a significant increase in the size of the bright region is seen. The schlieren image is more vivid (Figure 5.17), when compared to the shadowgraph (Figure 5.18). The images also reveal the extent of symmetry of the solutal distribution and the underlying flow field in the stable growth regime of the crystal. As in interferograms, schlieren and shadowgraph reveal the following sequence of events: (a) The plumes associated with crystal dissolution are unsteady; (b) the growth process enters a stable growth regime till the crystal size exceeds a critical value; and (c) the flow field approaches a stagnant condition when the solution becomes stratified.
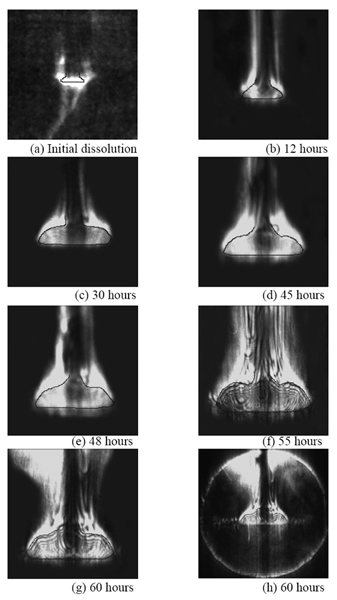
Figure 5.17: Evolution of schlieren images around the growing crystal from an aqueous solution. Images have been contrast-enhanced to reveal clearly the regions of high brightness. In (h) the original photograph as recorded by the camera is shown. The crystal position has been highlighted.
|