COMPARISON OF INTERFEROMETRY, SCHLIEREN AND SHADOW-GRAPH IN A CRYSTAL GROWTH EXPERIMENT
The applications of interferometry, schlieren and shadowgraph as tools for visualization of buoyant convection and on-line monitoring of KDP crystal growth from its aqueous solution are discussed in the present section. The ramp rate here is around  that is quite high in comparison to the rates employed in Section Influence of Ramp Rate and Crystal Rotation on Convection Patterns of the present lecture. The resulting convection patterns, as a result, form earlier in the experiments discussed. Images of the time-evolution of the convective field in the growth chamber have been recorded. The three measurement techniques are compared in terms of image quality and the potential for extracting quantitative information. that is quite high in comparison to the rates employed in Section Influence of Ramp Rate and Crystal Rotation on Convection Patterns of the present lecture. The resulting convection patterns, as a result, form earlier in the experiments discussed. Images of the time-evolution of the convective field in the growth chamber have been recorded. The three measurement techniques are compared in terms of image quality and the potential for extracting quantitative information.
CONVECTION PATTERNS
When a seed of the crystal is inserted in the solution, the initial temperature difference between the two leads to the dissolution of the seed itself. The local density of the solution increases, and consequently the solution descends vertically from the crystal. With the passage of time, thermal equilibrium is established, and density differences within the solution are solely due to concentration differences. Adjacent to the crystal, the solute deposits on the crystal faces, and the solution goes from the supersaturated to the saturated state. Thus the solution near the crystal is lighter than the solution away from it. The denser solution displaces the lighter fluid, and a circulation pattern is set up around the crystal. The structured movement of the fluid, called a buoyant plume is essential for transporting the solute from the bulk of the solution to the crystal and determines the crystal growth rate. The plume is visible in the three visualization techniques: as fringe displacement in interferometry, and the spread of light intensity in schlieren and shadowgraph. 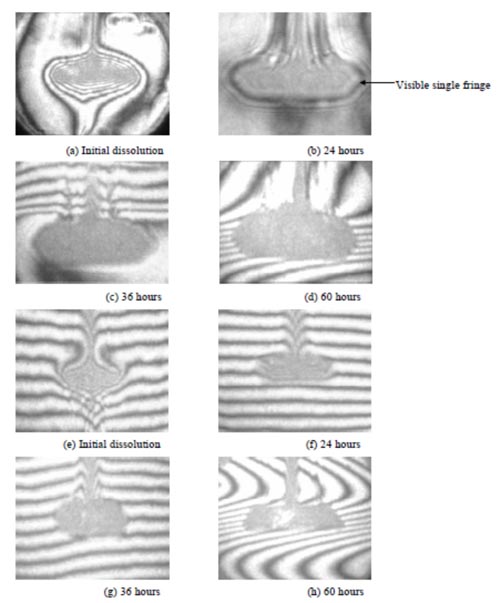
Figure 5.16: Time sequence of the evolution of interferograms around the growing crystal. (a-d) Infinite Fringe setting; (e-h) Wedge fringe setting. The initial crystal size in the infinite fringe setting is greater than in the wedge fringe setting. Large fringe slopes in (e-h) very close to the glass rod are possibly distortions. The opposing fringe curvatures above and below the crystal in (h) show a lighter and a denser solution formed by stratification
|