The analysis of the temperatures field reported in the present study is based on the dominant fringe patterns. It was not possible to capture the momentary appearance of the secondary mode, but a visual examination showed it to be straight fringes, and hence equivalent to a longitudinal roll. The estimated to be around ten seconds, corresponding to a frequency of 0.1Hz and a Fourier number  of 0.25. Frequencies of a similar order of magnitude have been reported by Gollub and Benson [126] in their LDV study of RB convection at Rayleigh numbers up to 100 times the critical Rayleigh number for the onset of convection. of 0.25. Frequencies of a similar order of magnitude have been reported by Gollub and Benson [126] in their LDV study of RB convection at Rayleigh numbers up to 100 times the critical Rayleigh number for the onset of convection.
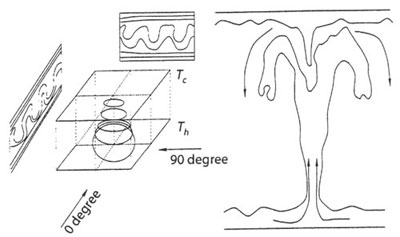
Figure 4.59: Schematic of the cubic cells and rising plume inside the cavity
The experimental results are compared next with those of Lipps [127]. This is a numerical study of Rayleigh-Benard convection in air over the range 4000<Ra <25000. The comparison is between the present experiments at Ra=4.02 x 10⁴ (aspect ratio= 1800) and the numerical prediction at Ra=25000 (aspect ratio = 5-6). Thos the comparison is at best qualitative. Lipps [127] has reported time-dependent oscillation in the fluid layer whose characteristic time scales are position dependent. On the midplane of the fluid layer, this was in the range  The mean flow itself had a periodicity of The mean flow itself had a periodicity of  The corresponding number for the present experiments based on visual judgment was 0.25, as mentioned in the previous paragraph. Despite this difference, typical isotherms shown by Lipps [127] are remarkably similar to the interferograms recorded in the experiments. Numerical calculations do not reveal plume formation, and instead, the author has indentified a tongue-like structure spreading in the horizontal plane. The corresponding number for the present experiments based on visual judgment was 0.25, as mentioned in the previous paragraph. Despite this difference, typical isotherms shown by Lipps [127] are remarkably similar to the interferograms recorded in the experiments. Numerical calculations do not reveal plume formation, and instead, the author has indentified a tongue-like structure spreading in the horizontal plane.
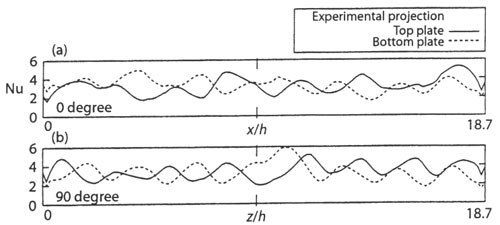
Figure 4.60: Experimentally obtained line-integrals of Nusselt numbers for both the Walls, Ra=4.02 x 10⁴, (a)  (b) (b) 
|