Table 9 shows that at any Rayleigh number the initial increase in Nusselt number is rapid. This is followed by a slow transient until steady state is reached. This behavior can be explained as follows. The initial increase in Nu is controlled by the formation of boundary-layers near the hot and cold walls and the characterstic distance is this boundary layer thickness. Hence, the characterstic time over which initial changes in Nu are significant is quite small. At larger times heat transfer is established across the cavity dimension and the chnges in Nu occur at slower rate.
For all three Rayleigh numbers studied, the initial fringe patterns are qualitatively identical to those shown in Figure 4.44 (a). the fringes in this figure shoe a thick boundary- layer and a plume descending downwards along the vertical axis of the cavity. This suggests that the flow is initially bicellular. At later times the flow pattern reverts to a unicellular form with nearly constant boundary-layer thickness over the horizontal cavity walls (Fig. 4.45(a)). There is a considerable amount of uncertainty in the exact time instant at which this transition occurs. It corresponds approximately to a Fourier number of 10 while steady state is reached at around  . Once the flow becomes unicellular, transients are characterized by the formation of newer fringes. This represents the penetration of the thermal front into the bulk of the fluid. The process continues until steady state is reached. . Once the flow becomes unicellular, transients are characterized by the formation of newer fringes. This represents the penetration of the thermal front into the bulk of the fluid. The process continues until steady state is reached.
Figure 4.36 (a-c) show the local Nusselt number at the cold wall of the cavity at respectively. Transient as well as steady state distributions are shown in these figures. The corner regions of the cavity are zones of high heat transfer and this is seen as spikes in the distribution of the local Nusselt number. These distributions show a minimum in the local Nusselt number at the midpoint of the cavity walls during the early transient. As stated above, this corresponds to the formation of two convection cells in the test call. In contrast, the local Nusselt number reaches a maximum around the same point at steady state. The local values of the Nusselt number differ considerably from their average computed over the mathematical definition of an average. An average based on Simpson’s rule has been used in present work.
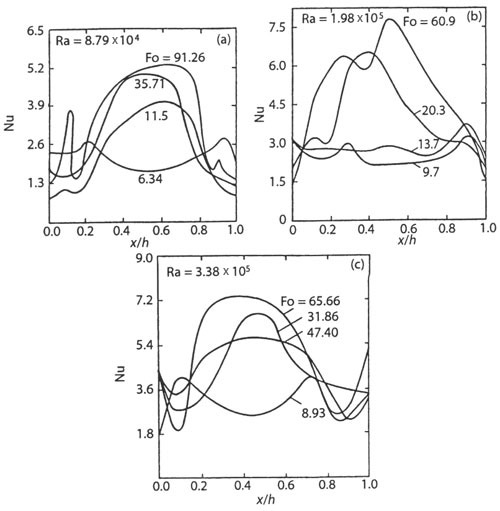
Figure 4.45: Local Nusselt number as a function of distance and time
Closure
Transient Rayleigh-Benard convection in a square cavity with rigid walls has been experimentally studied. Results show that the time-evolution of flow is initially bicellular, while it is unicellular at steady state. The sense of unicellular motion depends on the experimental bias. Experiments also show a large variation with distance in the local Nusselt number at the cold wall. The evolving flow shows symmetry at the lowest Rayleigh number studied. Symmetry is however lost when the Rayleigh number is increased. The average cavity Nusselt number reaches a maximum at steady state.
|