Evolution of the Flow Field
Figure 4.44 (a-c) respectively show the original fringe pattern, the fourier-filtered image and, the fringe skeleton extracted using the procedure given earlier. The figure represents fringe patterns in the vicinity of the cold upper wall during the transient period at a Rayleigh number of figure 4.44 (a-c) and a Fourier number of 6.34. Figures show the original and the processed fringes near the cold wall for the same Rayleigh number at a Fourier number of 91.26. The near-wall fringes are nearly stationary at this time and steady state can be assumed to have been reached.
The interferograms shows above have been obtained at the infinite fringe setting and hence fringes are coincident with isotherms. At the center of the cold wall, the isotherms in Figure 4.44 are straight and hence correspond to parallel flow. A displacement of the isotherms is indicative of transverse flow. This is seen near the side walls in Figure 4.44 where flow moves up and down in the vertical direction to complete a loop. Displacement of the isotherms is also seen at the center of the cavity in figure 4.44. This is proof of the existence of two convection cells during the early stages of evolution of fluid movement.
Heat Transfer
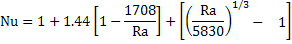
Table 8 compares the average Nusselt number computed in the present work at the end of three hours with the steady state correlation given in
Gebhart al. [89]. This correlation is applicable for a rectangular cavity with a moderate aspect ratio, but is independent of the aspect ratio itself. It is given as
for  . The variation of the Nusselt number for each half of the cavity and for the cavity as a whole as a function of time are given in Table 9. A study of the transient data reveals the following features. For a given Rayleigh number, the average Nusselt number in the cavity is a maximum as steady state is reached. This is quite consistent with the fact that the flow (measured in terms of the maximum velocity or minimum stream function) is initially quiescent and increasingly becomes vigorous with the passage of time. . The variation of the Nusselt number for each half of the cavity and for the cavity as a whole as a function of time are given in Table 9. A study of the transient data reveals the following features. For a given Rayleigh number, the average Nusselt number in the cavity is a maximum as steady state is reached. This is quite consistent with the fact that the flow (measured in terms of the maximum velocity or minimum stream function) is initially quiescent and increasingly becomes vigorous with the passage of time.
Table 8: Average Steady State Nusselt Number in a Square Cavity
|
Nu (present) |
Nu [89] |
% difference |
8.79 |
3.56 |
3.89 |
8.5 |
19.8 |
4.35 |
4.67 |
6.9 |
33.8 |
5.07 |
5.30 |
4.3 |
|