Image Processing
The information generated by Mach-Zehnder interferometer is available in the form of interference fringes. The interferograms contains information about the temperature itself in two-dimensional fields. In three-dimensional problems, interferograms must be recorded at various projection angles and must scan the complete fluid domain. Temperature distribution can subsequently be determined by interpreting the interferometric images as path integrals and applying principles of three-dimensional reconstruction. Tomographic alogorithms are applicable in this context. Tomography falls in the class of inverse techniques and its performance is characterized by a definite dependence on noise levels in the prescribed data. Specifically, errors in data can be amplified during the reconstruction process. It is thus natural to examine the sensitivity of the reconstructed temperature field to uncertainties and errors that are intrinsic to image enhancement operations that required processing the interferograms. For both two- and three-dimensional measurements, the fringe patters thus have to be analyzed in detail.
One of the operations required most often is the extraction of the fringe skeleton from the dark and bright bands of the fringes. When the interferometer is operated in the infinite fringe setting, the fringes are a set of curves that are the locus of points having an identical path difference. This can be interpreted as follows: For rays having a certain path difference, the corresponding pixels in the interferometric image will have identical light intensity. One of the direct ways to locate a typical locus of points is to connect all minimum intensity pixels within a dark band or the maximum intensity pixels within a bright band. The minimum intensity will appear at a point of complete destructive interference and hence will have a zero intensity. Similarly, a maximum in intensity will appear at a point where interference is constructive.
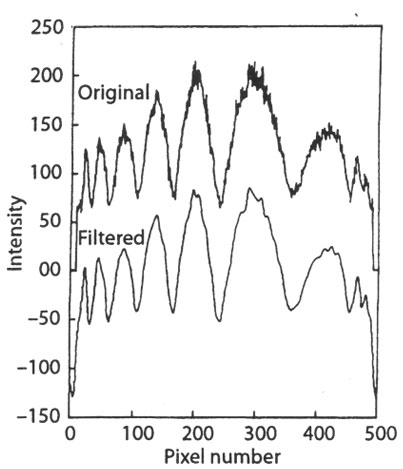
Figure 4.16: Original and filtered intensity distributions in an interferogram.
more...
|