contd..
Using unmixed model and an empirical relation giving mass fraction burned as a function of crank angle, the computed engine cylinder pressure - crank angle (P-θ) history is shown on Fig. 2.5 .
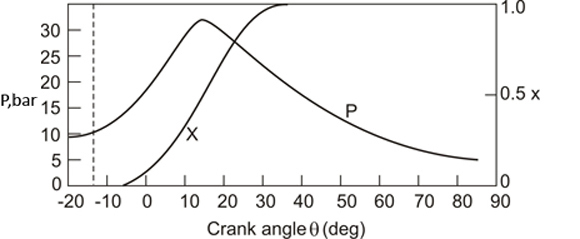
Figure 2.5 |
Computed cylinder pressure- crank angle (P-θ) history using unmixed combustion model and an empirical combustion rate function. |
Fig 2.6 shows the variation in temperature with respect to crank angle for (i) the unburned mixture (Tu) (ii) the charge element that burned at the beginning of the combustion process ( Tbat x =0 ) and (iii) the charge element that burned last at the end of combustion( Tb at x = 1.0 ). As seen the charge element close to the spark plug that burns in the beginning itself reaches a much higher temperature compared to the element that burns last. The difference in the calculated temperatures of two elements at a given crank angle is seen close to 400 K
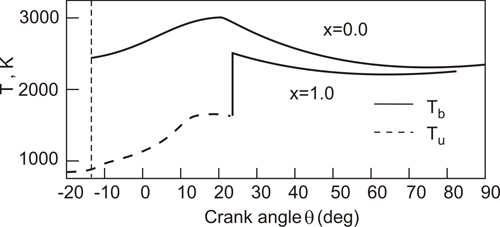
Figure.2.6 |
Unburned gas temperature (Tu), burned gas temperature for the first burned element ( Tb for x=0) and the last burned element (Tb for x =1.0). |
|