Distillation
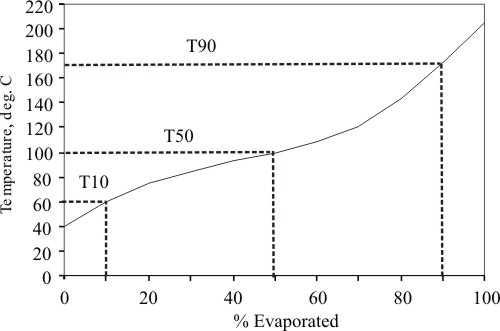
The distillation characteristics of gasoline are presented by a curve relating percent volume of fuel evaporated to temperature as shown in Fig 8.1. Temperatures for evaporation of 10 % (T10), 50% (T50), 90% (T90) and final boiling point (FBP) of fuel are important features of the distillation curve and their limits or equivalent are specified in the gasoline standard specifications.
| Figure 8.1 |
Typical disillation curve of motor gasoline |
Distillation range influences engine exhaust emissions through its effect on fuel evaporation characteristics, mixture formation and hydrocarbon composition. HC emissions during cold start and warm-up may be influenced by the front-end volatility (T10). An increase in T50 has been seen to decrease HC emissions. A lower T90 has been seen to increase CO and NOx emissions in some engines but it reduces other air pollutants; butadiene and formaldehyde which are known as ‘air toxics’.
Reid Vapour Pressure
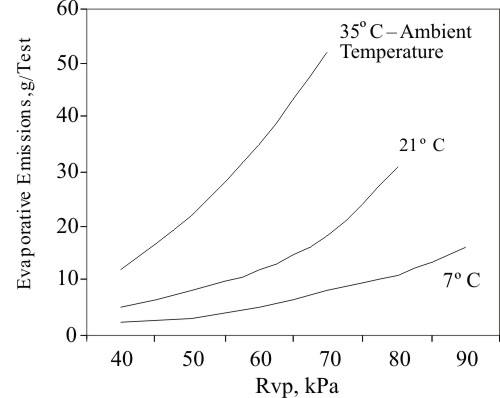
Reid vapour pressure (RVP) is measured at 37.8º C in a closed bomb having 4 times the volume of liquid fuel.. At low ambient temperatures for good cold starting and faster engine warm-up a high vapour pressure is required. But, in warm and hot ambient conditions, a high Reid vapour pressure results in high evaporative emissions and may overload the carbon canisters of the evaporative control system with the hydrocarbon vapours. RVP has good correlation with the fuel evaporation losses during refuelling and from the fuel tank and carburettor. Evaporative hydrocarbon emissions as a function of RVP and ambient temperature are shown on Fig. 8.2. The evaporative emissions increase almost linearly with increase in RVP. For a given fuel RVP, the evaporative hydrocarbons increase as the ambient temperature increases.
| Figure 8.2 |
Dependence of evaporative hydrocorbon emissions on RVP and ambient temperature . |
|