| |
In this model we have  , i.e., an AR(1) model. A close look at this AR(1) model immediately makes it clear that if , i.e., an AR(1) model. A close look at this AR(1) model immediately makes it clear that if  , then the process blows up. Consider we have 6 particles in all and for simplicity each cell marked A and B has three particles in each. Hence from state , then the process blows up. Consider we have 6 particles in all and for simplicity each cell marked A and B has three particles in each. Hence from state  we can go to state we can go to state  or or  , which means that when we move from , which means that when we move from  to to  , then the corresponding probability is , then the corresponding probability is  , while for the movement from state , while for the movement from state  to to  it is it is  . Thus the transition matrix is of the form as shown . Thus the transition matrix is of the form as shown  and if we draw the graph then we have the movement of the particle as given in Figure 6.2 and if we draw the graph then we have the movement of the particle as given in Figure 6.2
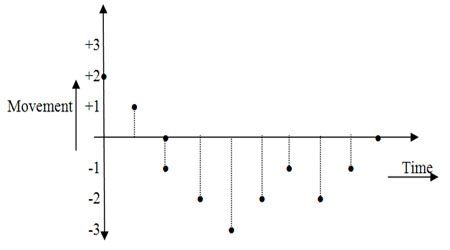
Figure 6.2: Diagrammatic representation of the movement of a particle
|