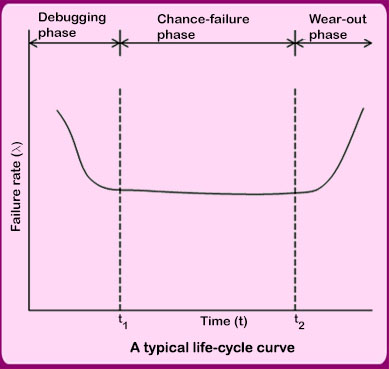
The life-cycle curve of Figure 3-8 shows the variation in the failure rate as a function of time in different phases. Conventionally the failure rate ( ) is plotted as a function of time. This curve is often referred to as the bathtub curve; it consists of the debugging (infant-mortality) phase, the chance-failure phase (useful life phase), and the wear-out phase. ) is plotted as a function of time. This curve is often referred to as the bathtub curve; it consists of the debugging (infant-mortality) phase, the chance-failure phase (useful life phase), and the wear-out phase.
The debugging phase, also known as the infant-mortality phase, exhibits a drop in the failure rate as initial problems identified during prototype testing are removed. The chance-failure phase, between times t1 and t2, is then encountered; failures occur randomly and independently. This phase, in which the failure rate is constant, typically represents the useful life of the product delivered to end customer. In the wear-out phase, an increase in the failure rate is expected due to wear and tear of the product. Here, after the end of their useful life, parts age and wear out. |