Tutorial 6
The objective of this tutorial is to impart knowledge about design of water distribution network for a community. We will only be designing the basic backbone of the network. Minor details, i.e., pipe sizes and water flow-rate into individual households, pipe connections, etc. are beyond the scope of this tutorial.
Consider Figure 1 given with this tutorial. Figure 1 shows the map of IIT Kanpur campus with the proposed water supply network superposed. The proposed network consists of 10 loops, 15 nodes and 24 pipes. Water will be fed to the network through four nodes shown in the figure. These nodes are the input nodes. Water will be abstracted from the network at various nodes (except the input nodes) which will be known as output nodes. The amount of withdrawal from a node will depend upon the expected water demand at the vicinity of the node. The reference pressure head for the network is 15 m at the water-input point near the MT section (0.4Q). The network will be laid at a depth of 0.5 m below the ground surface. The network should be able to deliver the required flow to each node with a pressure head of at least 12 m.
Calculations must be done as follows for designating the output nodes and the outflow from such nodes:
· Designate 10 nodes in the network as output nodes.
· Designate an area in the immediate vicinity of the output node as the area whose water demand will be met by that node.
· Calculate the water demand from that area. The water abstraction rate from the output node will be equal to the water demand.
· Similarly calculate the water abstraction rate from each output node.
· Remember, the total water abstraction rate must be exactly equal to the water inflow to the water distribution system.
Based on the available information as described above, the water supply network must be designed. Design will include determining the diameter of various pipes and checking to ensure that the pressure head available at various nodes is at least 12 m.
A computer program called LOOPS will be used for designing the water distribution network. This software has already been sent to you by electronic mail. I hope you have already installed it on some PC of your choice. For your convenience, this software has also been installed in five PCs of the VARUN laboratory. To use this software in VARUN laboratory, go the START menu of the PC, scroll to ‘program’ and then scroll to ‘LOOPS’.
Instructions for Using LOOPS (Can be Downloaded from Website):
Consider the water distribution network shown in
Figure 2.
·
Show the water abstraction rates at various designated output nodes
based the calculations described earlier.
·
Name the 10 loops in the network as 1, 2, 3, … 10 in any order you
choose
·
Name the 15 nodes in the network as A, B, C,….
O in any order you choose.
·
Name the 24 pipes in the network as 1, 2, 3, ….. 24 in any order you
choose.
·
Determine the length of each pipe in meters using the scale given in
Figure 1.
·
Determine the position of each node (x, y), w.r.t any arbitrary origin.
·
Determine the approximate height of each node by consulting the contour
map of the campus. Remember, the pipe
network is 0.5 m below the ground level.
·
Show an assumed direction of flow in each pipe.
·
In each loop, determine the number of pipes, and the numbers designated
to each of those pipes. This number is
positive if the assumed flow in the pipe is in clockwise direction, otherwise
the number is negative.
·
Determine the co-ordinates (x, y, and z) of each node.
·
Determine inflow/outflow from nodes.
Remember, inflow is positive, outflow is negative.
·
Determine for each pipe the
initial and final node, as per assume direction of flow.
The data generated above should be input to the
LOOPS program, and the network analyzed.
If the pressure head in any node is less that 12 m. appropriate
modifications in pipe diameters feeding that node should be made to increase
the pressure head. A graphical depiction
of the analyzed depiction showing flows in various pipes and pressure head at
various nodes must be presented. Also
satisfy yourself that the solution is correct, i.e., the mass balance and
head-loss criteria are satisfied.
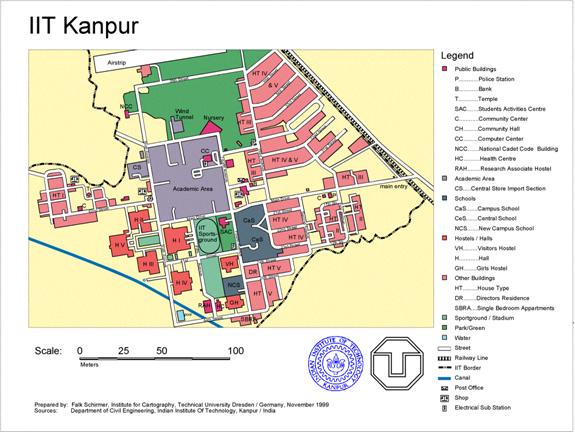
Figure
1. Water Supply Network Superposed on the IIT

Figure 2. Water Distribution Network to be Analyzed
Using LOOPS