Basic Concepts of Flow
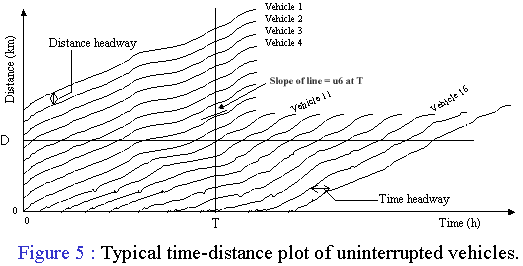
Flow, unlike density, is a point measure. It is defined as the number of vehicles that cross a section of the roadway per unit time.The units of flow is vehicles per hour(vph) or vehicles per hour per lane(vphpl). As per the data given in Figure 5 (reproduced from lecture 1), the flow across a section at a distance D, over a period of T is 8/T vph. Note 8 is the number of times the time-distance plots cross the line drawn at D between 0 and T. Physically, this means that someone standing at D from time = 0 to time = T will count 8 vehicles crossing him/her.
Flow, in a way , measures how many vehicles are being serviced by the road. It is of good interest to the service providers and not much to the individual drivers. Notice, that parameter speed and density (which implied proximity of other vehicles) are of interest to and do affect the behaviour of drivers. Sometimes microscopic measure of flow (i.e. Time Headway) is of interest to individual drivers (we shall see this later). It can be seen from Figure 5 (reproduced from lecture 1), that flow is equal to the reciprocal of the average time headway.
Advanced Concepts
Microscopically flow is related to time headways; time headways are simply referred to as headways. As is expected not all time-headways are the same. Studying the distribution of time headways therefore becomes imperative. Studying the probability distribution of headways helps in studying time losses at signalized intersection, delays at unsignalized intersection delays at merging operations and various other things. The study of headways distribution is also extremely important in order to able to simulate traffic streams realistically.
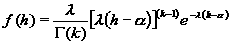
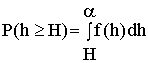
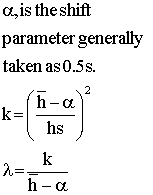
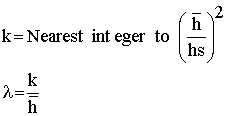
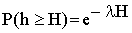
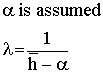
A lot work has been done on headway distributions. Generally, the Pearson Type III family of distribution is used to represent headway distributions. Here, a brief description is provided through the following table. In the table, 'h' represents the variable headway, ![]()
Table : Probability Distributions Generally used to Model Headway (from May [4]) |
||||
Name |
Prob. density function, f(h) |
P (h ≥ H) |
Para-meters |
Estimating parameters from observed data or otherwise |
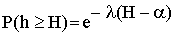
| Pearson Type III (h must be greater than α) |
 |
 |
 |
 |
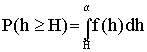
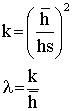
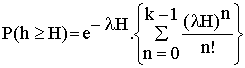
| Gamma (like Pearson III with α = 0 ) | 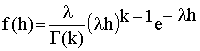 |
 |
 |
 |
| Erlang (like Gamma but k is an integer) | |
 |
 |
 |
| Negative Exponential ( like Erlang but k =1) | 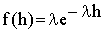 |
 |
 |
 |
| Shifted Negative Exponential (like Pearson III but k =1) | 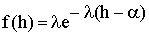 |
 |
 |
 |
An example of a typical frequency and relative frequency headway distribution for headway is shown in Figure 7(a) and 7(c) respectively.
.gif)
.gif)
The mean headway for the data is 2.46 second and the standard deviation is 1.196 seconds. Hence the parameters of the Erlang distribution is k = 4, λ = 1.63. This fitted Erlang distribution is shown in Figure 7(b). The comparison of the predicted relative frequency and the observed relative frequency (try to remember the definition of relative frequency) is shown in Figure 7(c).
.gif)