| VISCOUS FLOW | ||||
It must be noted that Moody chart covers extremely wide range of flow parameters i.e. diameter of the pipes This equation is called "Colebrook formula" and is valid with 10% accuracy with the graphical data.
|
||||
| Prev | ||||
| VISCOUS FLOW | ||||
It must be noted that Moody chart covers extremely wide range of flow parameters i.e. diameter of the pipes This equation is called "Colebrook formula" and is valid with 10% accuracy with the graphical data.
|
||||
| Prev | ||||
 , fluid density
  , viscosity
  and velocities
  in non-laminar regions of the flow
 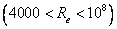 that almost accommodates all applications of pipe flows. In the non-laminar regions of fluid flow, Moody chart can be represented by the empirical equation i.e.
 (25)
(25)