Chapter 2: Volumetric Properties of Real Fluids

Section 1 : General P-V-T Behaviour of Real Fluids
 

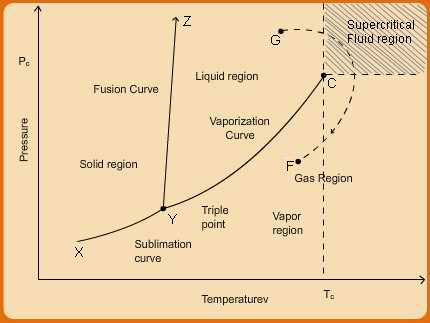
In fig. 2.1b the phase behavior depicted in fig. 2.1a is extended and more generalized to include solid phase as well. Accordingly, not only vapour-liquid region, other two phase regions, i.e., solid-vapour and solid-liquid regions are also displayed. The same arguments as made above for explaining the nature of co-existence of vapour and liquid phases apply to the other two biphasic regions.

P-T Diagrams

The phase behaviour described by fig. 2.1 can also be expressed in a more condensed manner by means of a pressure-temperature (P-T) diagram shown in fig 2.2. Just as P-V curves were depicted at constant temperature, the P-T diagram is obtained at a constant molar volume. The two phase regions which were areas in the P-V diagram are reduced to lines (or curves) in fig. 2.2. The P-T curves shown by lines X-Y, Y-Z, and Y-C resultfrom measurements of the vapour

Fig. 2.2 Pressure-Temperature Diagram of a Pure Substance